TRACER
Transition Radiation Array for Cosmic Energetic Radiation

TRACER
|
|
 Introduction Commanding and communication system Main control panel Internal functions LDB computer functionsMonitor functionsEvent monitor functions High voltage system Gas system AMPLEX thresholds VME computer system Flight computer hard disk system Data Acquisition system Logfiles Postscript output
The latest version of this manual is avaliable at http:/ /particle.astro.ru.nl/tamara.html.
Introduction
The TrAcer Monitor And Remote Application program TAMARA allows
to control and monitor the TRACER balloon
instrument.
TAMARA consists of two parts, one part is a graphical user interface on the
ground computer (LINUX), the second part is located on the flight CPU (QNX)
acting as
software interface between the NSBF flight computer and the TRACER
flight CPU software by Joe W. Britton.
Commanding and telecommunication system
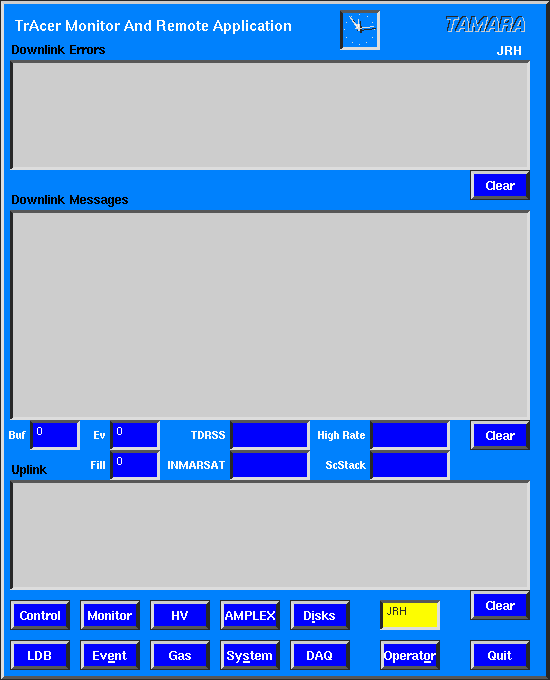
The program is started by entering the command tamara and the main command panel becomes visible. This panel contains three text browser windows. The windows Downlink Messages and Downlink Errors contain messages received from the flight CPU. All messages displayed in these windows are are logged in addition in a file receive.log together with a time stamp.
An example of this file is given here:
Fri Jun 25 23:06:56 1999 Housekeeping Block 32
Fri Jun 25 23:06:56 1999 Status/Error Message len=10 nature=11f0
Fri Jun 25 23:06:56 1999 MainStatus: PID=7063 CPUMonInt=30 sec AMPLEX Ped Int=30 sec ping time out = 3600 sec
Fri Jun 25 23:06:56 1999 Status/Error Message len=6 nature=61f0
Fri Jun 25 23:06:56 1999 Telemup Stat PID 9103 = 135462139
Fri Jun 25 23:06:56 1999 Status/Error Message len=24 nature=41f0
Fri Jun 25 23:06:56 1999 ParseStat: PID=10629 lev=-1 chMQint=30 s RndEv: 5 evts 5 s #ev: Rnd=0 Ped=0 Gold=0
Fri Jun 25 23:06:56 1999 Status/Error Message len=16 nature=21f0
Fri Jun 25 23:06:56 1999 InpStat no of events: 168603 total 168503 Data 100 Hskg
Fri Jun 25 23:06:56 1999 Status/Error Message len=52 nature=31f0
Fri Jun 25 23:06:56 1999 OutStat pid=10626 Data=-1 Back=-1 Dfile=-1 Bflie=-1 Errlev=0 last Backup=930350670
300 MB free Errorlevel=0 SCSI ID=0
300 MB free Errorlevel=0 SCSI ID=1
300 MB free Errorlevel=0 SCSI ID=2
300 MB free Errorlevel=0 SCSI ID=3
Fri Jun 25 23:06:56 1999 Status/Error Message len=112 nature=51f0
Fri Jun 25 23:06:56 1999 DIO stat: PID:10632 PeressChckInt: 0
AMPLEX thr= 0 0 0 0 0 0 0 0 0 0 0 0 0 0 0 0 0 0 0 0 0 0 0 0 0 0 0 0 0 0 0 0 0 0 0 0 0 0 0 0 0 0 0 0 0 0 0 0 0 0 0 0 0 0 0 0 0 0 0 0 0 0 0 0
Valves Main=0 Vent=0 Inp=---------------- Exh=----------------
Fri Jun 25 23:06:56 1999 Status/Error Message len=6 nature=71f0
Fri Jun 25 23:06:56 1999 Telemdown Stat PID 10643 = 135462139
Fri Jun 25 23:06:56 1999 Status/Error Message len=14 nature=41f1
Fri Jun 25 23:06:56 1999 MQ occupancy 0 0 0 0 0 23
Fri Jun 25 23:06:56 1999 TDRSS COMM Low Rate1> 80 byte
Fri Jun 25 23:06:56 1999 Position Block
Fri Jun 25 23:06:56 1999 Housekeeping Block 32
Fri Jun 25 23:06:57 1999 INMARSAT COMM Low Rate2> 80 byte
Fri Jun 25 23:06:57 1999 Position Block
In the Uplink window, all submitted commands are logged. This messages are logged in a file send.log as well. Each entry contains a time stamp and the name of the responsible person. An example for the file is given here:
Mon Jun 28 22:22:13 1999 JRH # 24 Mqueue Chck Int ID=27 data= A 0
Mon Jun 28 22:32:52 1999 JWB # 4 Disk Mode ID=31 data= 0 0
Mon Jun 28 22:33:07 1999 DM # 5 AMPLEX All ID=C1 data=8A 8A
Mon Jun 28 22:33:21 1999 DM # 12 Set HV ID=A1 data=60 0
Mon Jun 28 22:33:22 1999 DM # 13 Set HV ID=A1 data=70 0
Mon Jun 28 22:33:25 1999 DM # 14 Set HV ID=A1 data=80 0
Mon Jun 28 22:33:26 1999 DM # 15 Set HV ID=A1 data=90 0
Mon Jun 28 22:33:34 1999 JWB # 16 Disk Mode ID=31 data= 0 0
Mon Jun 28 22:33:46 1999 JWB # 17 CPU Mon Int ID=24 data= A 0
Mon Jun 28 22:33:48 1999 JRH # 18 Mqueue Chck Int ID=27 data= A 0
Mon Jun 28 22:33:58 1999 JRH # 19 AMPLEX All ID=C1 data=8A 8A
Mon Jun 28 22:34:03 1999 JRH # 20 Req manif press ID=B5 data= 0 0
The operator's name can be changed using the button OPERATOR. It is displayed in the yellow window above the OPERATOR button.
The browser windows may be cleared using the associated CLEAR buttons.
The number of received data events and fill blocks per second are indicated in two windows. This feature is especially useful, when data are received via the LOS receiver. For each satellite downlink (TDRSS, INMARSAT and TDRSS high speed link), the time of the latest received package and its length is documented in a control window, as well as the time of the latest received data block from the NSBF science stack.
Furthermore the main control panel contains buttons to execute different
groups of commands:
CONTROL: Internal functions
LDB: LDB computer functions
MONITOR: Monitor functions
EVENT: Event monitor functions
HV: High voltage system
GAS: Gas system
AMPLEX: AMPLEX thresholds
SYSTEM: VME computer system
DISKS: Flight computer hard disk system
DAQ: Data Acquisition system
The program can be terminated executing the QUIT command.
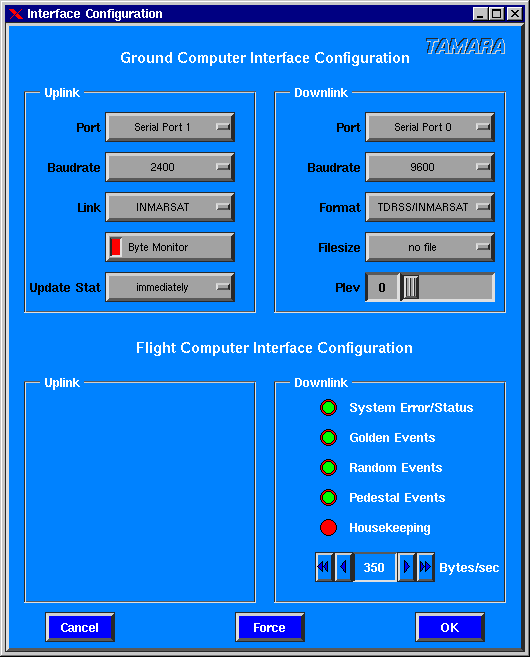
The configuration of the ground and flight CPU interfaces of TAMARA is performed by this panel.
For the Uplink several features can be configured: The serial port and the baudrate. The commands can be transmitted to the instrument via three possible links: LOS (line of sight), TDRSS and INMARSAT satellites. If the byte monitor is switched on, all transmitted bytes are displayed in the Uplink window.
A critical point of the control program is the update of the current balloon status. The user can select between the options immediately and after confirmation. In the first case, the status is updated at the time, a command is submitted to the balloon. This can be a good choice if the downlink stream is not available. For the second case, the balloon status in the ground program is updated when the receipt of a command is confirmed by the balloon.
The Downlink can be configured, using the following options: To receive satellite data, the input port should be Serial Port 0 or Serial Port 1, the baudrate should be adjusted correct and the Format should be TDRSS/INMARSAT. Line of sight (LOS) data can be received, using an ACB-II/EX RS422 serial interface by selecting ACB-II/EX 0 as input Port and LOS as corresponding Format. Since the RS422 interface is operated in a synchronous mode, the Baudrate selection has no influence to this function.
The received data events can be written to a files of limited sizes by selecting Filesize different from no file between 10 MB and 500 MB. The events are written to files events.dmp_1 ... events.dmp_? the last number is increased automaticly. The user can reduce the number of messages in the Downlink Messages window by increasing the printing level (Plev).
For the flight computer interface only downlink options can be specified. Different types of data can be selected to be transmitted to the ground: system messages from the VME flight CPU, special selected (golden) events, randomly selected events, events from a pedestal run as well as instrument housekeeping blocks. Since the speed of the TDRSS high speed link is limited by NSBF, the number of bytes to be transmitted to the ground can be adjusted.
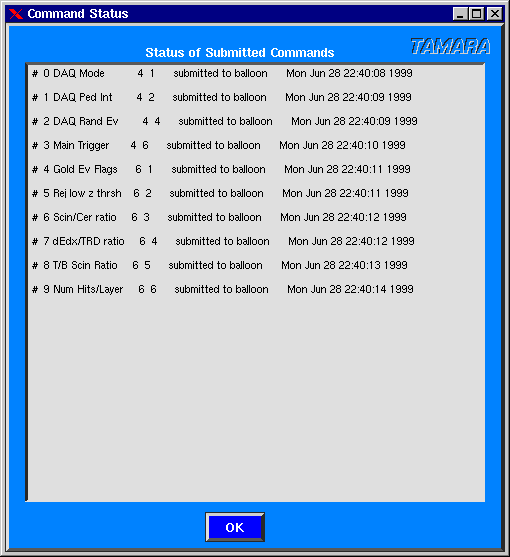
This panel sumarices the status of all submitted and not confirmed commands. After submission, a command is added to the displayed list. The receipt of each command by the balloon is confirmed to the ground computer and the command is erased from the list. Commands remaining in this list for a longer time indicating an error during the transmission of the command.
LDB computer functions
Different informations can be requested from the NSBF flight CPU.
Monitor functions
The Monitor button allows to execute a group of commands to
monitor the current status of the instrument.
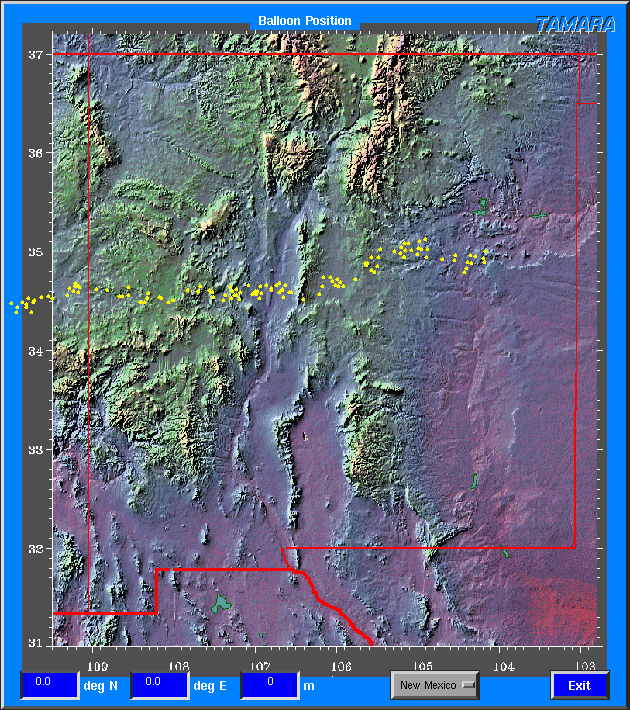
The actual position of the balloon is indicated in a map as well as the projection of the balloon trajectory to ground. Maps of different areas can be selected.
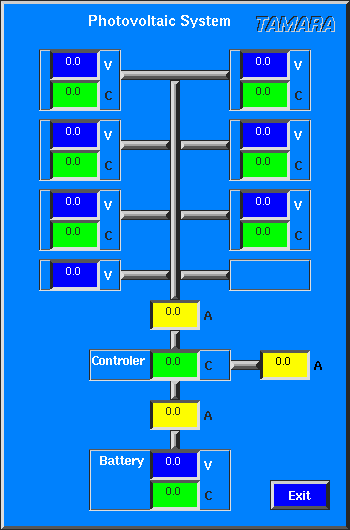
The current values of the voltage, current, and temperature sensors of the solar system can be monitored with this function.
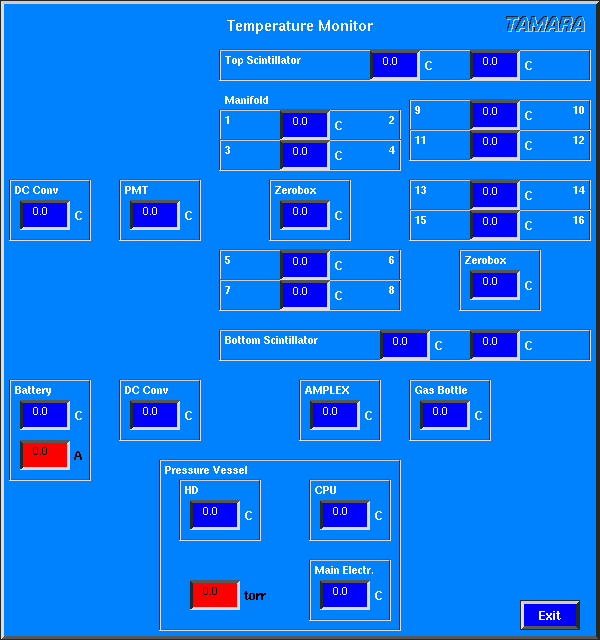
Several temperature sensors are distributed within the TRACER instrument. The panel shows their actual value as well as the pressure inside the pressure vessel and the total current consumed by the instrument. A range can be specified for each group of sensors in the file tamara.ini. An example of a part of this file is given here:
#
# Monitor Limits
# Temperature ranges (deg/C)
TMANIF = 0 30 # Manifold temperature
TSCIN = 0 30 # Scintillator temperature
TAMPLEX = 0 30 # AMPLEX card temperature
TCRATE = 0 30 # Crate (AMPLEX + PHA) temperature
TDCCONV = 0 30 # DC converter temperature
TVESS = 0 30 # Temperature inside pressure vessel
TGAS = 0 30 # Gas bottle temperature
TBATT = 0 30 # Battery temperature
# Pressure ranges (torr)
PMANI = 280 320 # Manifold pressure
PBOT = 100 3000 # Gas bottle pressure (PSI)
PSPHERE = 520 790 # Pressure inside pressure vessel
# Current ranges (A)
IMAIN = 4 7 # Instrument main current
If the actual value of a sensor is outside the recommended range, the sensor is displayed with a red background in the panel.

The position of the balloon instrument is available from a GPS receiver on the payload. The actual GPS values can be monitored by this function. The height of float is available from barometric measurements as well.
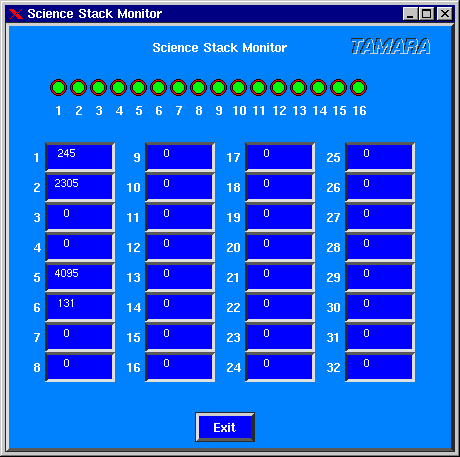
The NSBF science stack allows to transmit 16 digital and 32 analog signals to the ground. The current status of all channels is displayed in the panel.
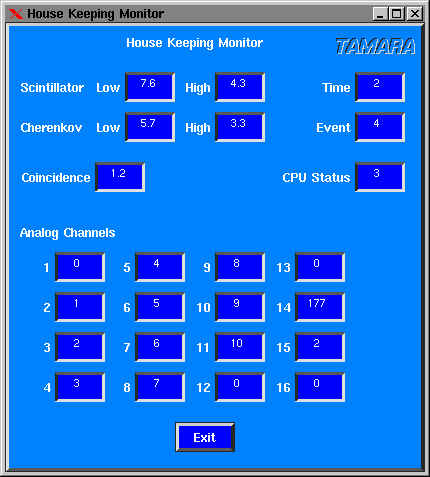
The house keeping data from the TRACER main electronics are displayed in this panel: The trigger rate of the top and bottom scintillator systems above their low and high thresholds. The trigger rate (Coincidence) and the number of recorded events per second (Event). A sequential number is assigned to each house keeping block (Time) and a bit pattern generated by the CPU (CPU status) is part of the house keeping information. In addition the ADC values of the 16 analog channels are displayed together with their corresponding voltage.
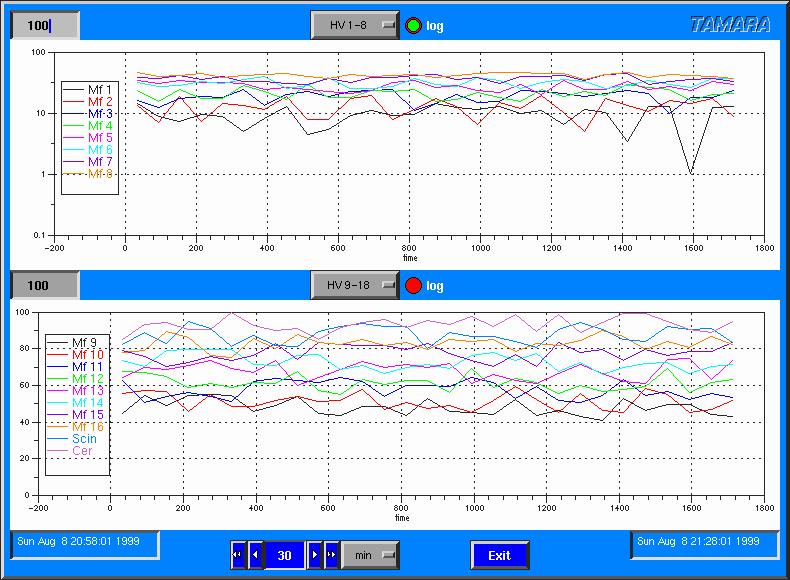
All available instrument monitor informations can be plotted as a function of time using this panel. The right (upper) end of the time axis corresponds to the actual time. A time interval can be specified between 1 min and 60 hours. The lower end of the time axis is the actual time minus the interval width. Begin and end (actual time) of the monitor interval are displayed on the left and right side respectively. Two identical areas to display the information are provided. The user can select between different groups of information to be displayed:
Event monitor functions
This function summarises several options to monitor the detector.
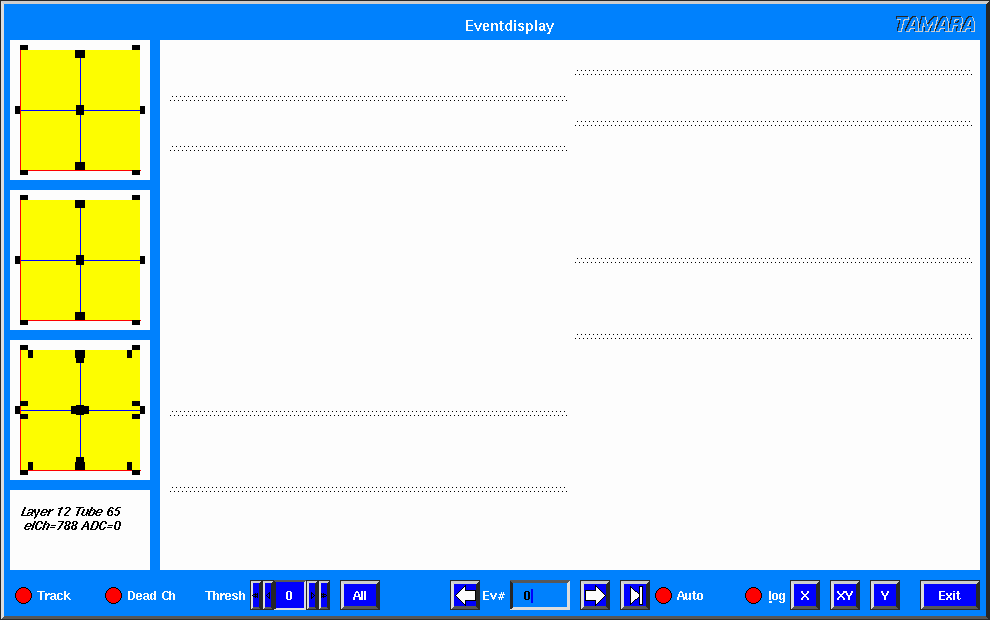
The event display shows all active components of the TRACER instrument. The top and bottom scintillator as well as the Cerenkov counter are displayed on the left side. The red lines indicate the "manifold sides" of the instrument. The "sun side" is at the bottom. The 1600 proportional tubes are arranged in 16 layers. Eight layers (four double layers) correspond to the "X" direction (left side of the display) and eight layers correspond to the "Y" direction (right side of the display). The Y direction corresponds to the "sun side" of the instrument. Only one projection or both projections can be selected using the X, Y, or XY buttons. The diameter of each displayed tube corresponds to the ADC signal of the individual channel in linear or logarithmic scale, selected by the log button.
500 events are buffered in an internal event buffer. The user can go through this buffer using the left and right arrow buttons. The Auto function displays automatically each incoming event. The user can select a threshold for the proportional tubes in ADC values above pedestal (Thresh). Tubes with values below this threshold are displayed in blue, all others in red. Only tubes with energy deposits above the threshold are included in the track-fit. The fit algorithm can be activated with the Track button. The track obtained from the proportional tubes is represented by a green line. The blue line represents an estimated particle trajectory obtained by calculating the center of gravity in the upper and lower scintillator plane. If the Dead Ch option is selected, dead electronic channels in the proportional tubes are displayed with ADC values of 255. The dead channels are listed in the file channel.ini.
All events in the event buffer can be superimposed by using the All function. All channels above the threshold are summed up and the value ADC/event*100 is plotted for each electronic channel.
The user can click with the mouse to a proportional tube in the display. The layer and tube number of the corresponding tube are displayed in the lower left corner of the display, as well as the electronic channel number and the current ADC value of the channel.
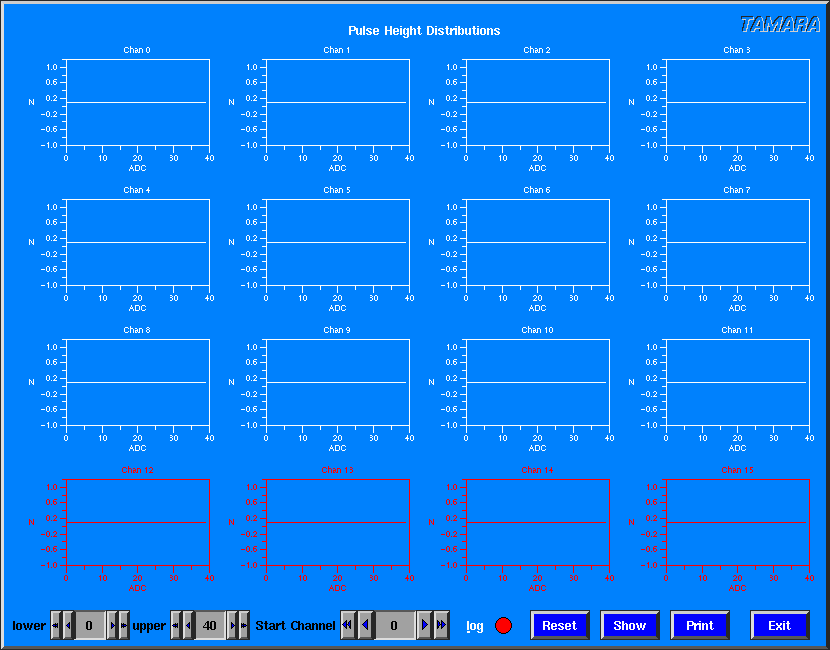
Pulse height distributions for individual electronic channels can be monitored online. A group of 16 channels is displayed on the panel. The first channel can be selected using the Start Channel selector. The lower and upper end of the abscissa can be adjusted (lower and upper). The ordinate can be displayed in linear or logarithmic scale (log button). The histograms are cleared by the Reset button. The Show function displays the group of channels in the event display. Channels corresponding to a proportional tube are shown in white, unused channels are displayed in red.
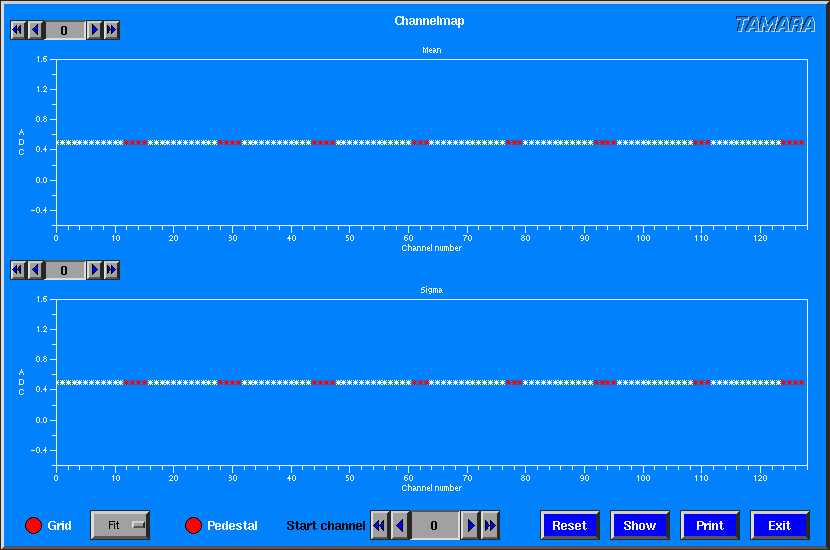
The mean and sigma values of the pulse height distributions are summarised in a channel-map for 128 channels. The start channel can be selected using the Start Channel selector. The maximum ordinate value can be adjusted using the selectors on top of each diagram. The user can select between a sigma value obtained from a Gauss fit to the pulse height distributions (Fit) and a RMS value (RMS). The histograms are cleared by the Reset button. The Show function displays the group of channels in the event display.
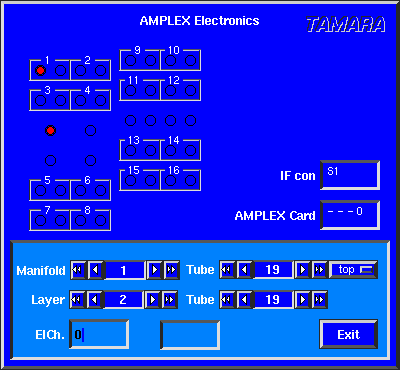
The AMPLEX system is sketched schematically in this panel. The 16 manifolds for the proportional tubes are displayed together with the 32 AMPLEX cards and the eight interface cards. The AMPLEX card and interface box for a specific channel is represented by a red point. The channel number and AMPLEX chip is displayed in the AMPLEX Card field.
Three different coordinate systems for the proportional tubes can be converted to each other.
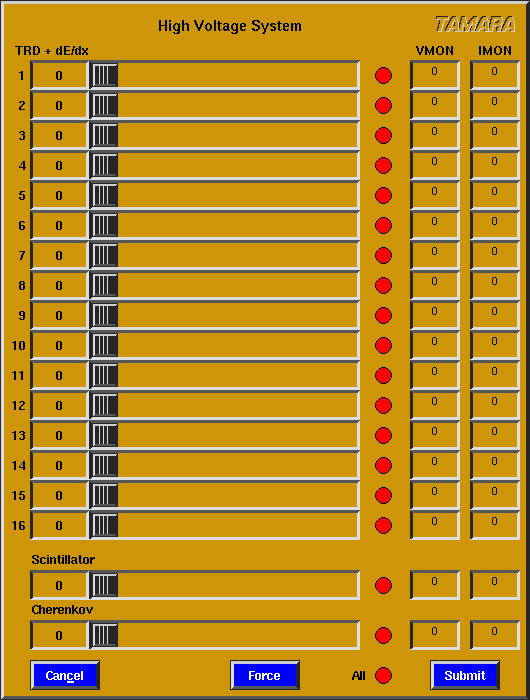
The high voltage for the 16 HV channels for the proportional tubes and one channel for the Cherenkov and scintillation counters respectively can be adjusted via this panel.
The current available status information is displayed as well. A range can be specified for each group of sensors in the file tamara.ini. If the actual value of a sensor is outside the recommended range, the sensor is displayed with a red background in the panel.
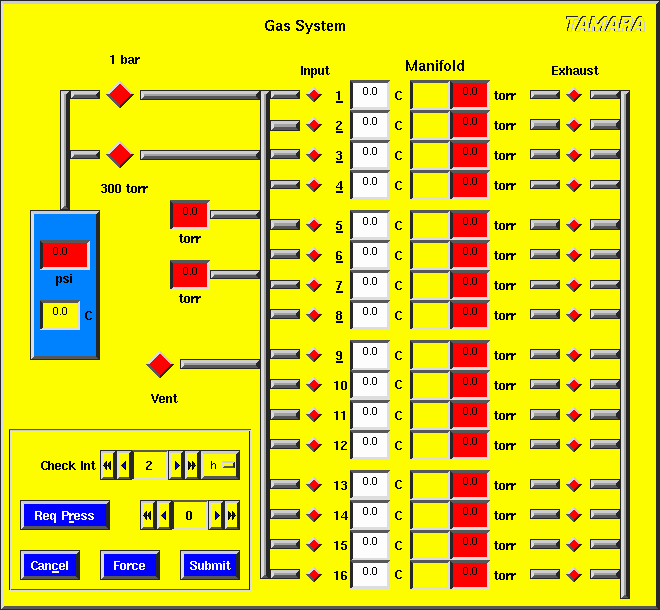
The TRACER gas system is sketched schematically in this panel. The current temperature and pressure is displayed for each manifold together with the pressure in the gas bottle. A range can be specified for each group of sensors in the file tamara.ini. If the actual value of a sensor is outside the recommended range, the sensor is displayed with a red background in the panel.
The valves can be opened and closed manually by a mouse click to the corresponding valve.
The current pressure of a manifold can be requested via the Req Press button, 0 corresponds to all manifolds. The pressure can be checked automatically by the flight CPU, the check interval can be adjusted.
The changes can be transmitted to the balloon by pressing Submit. All displayed settings will be transmitted by pressing Force. To leave the panel without transmitting the changes to the instrument, press Cancel.
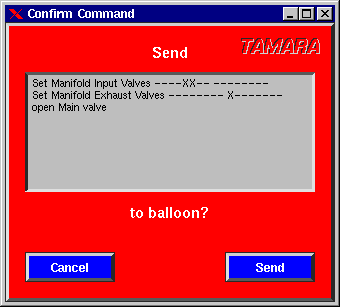
Critical commands like high voltage or gas system commands have to be confirmed before submission to the detector. A typical confirmation panel is shown in the following.
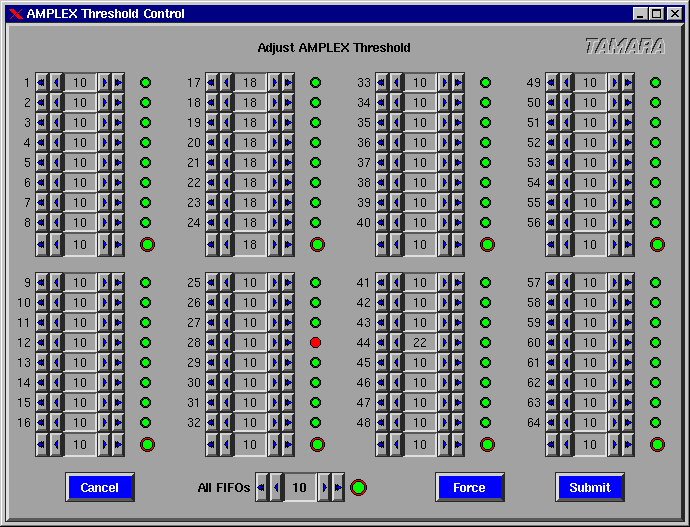
The thresholds for the 64 FiFos of the AMPLEX electronic can be adjusted individually, as well as each FiFo can be switched on or off. Groups of eight FiFos can be adjusted at once, as well as all channels can be manipulated at a time.
The changes can be transmitted to the balloon by pressing Submit. All displayed settings will be transmitted by pressing Force. To leave the panel without transmitting the changes to the instrument, press Cancel.
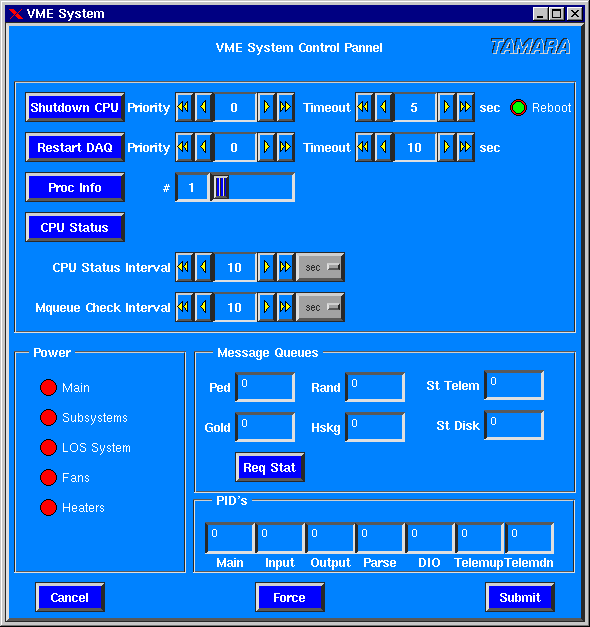
The VME flight CPU system can be controlled by this panel. Two possibilities can be selected to shutdown the CPU: restart or halt. A time interval before shutdown can be specified. The data acquisition program can be restarted by the Restart DAQ command. The flight CPU runs 7 processes in parallel. Proc Info requests the status information of the specified process (Main=1, Input=2, Output=3, Parse=4, DIO=5, Telemup=6, Telemdown=7). A detailed CPU information is requested by the CPU Status command. CPU status information is transmitted automaticly to the ground at the end of a selectable interval. The interval to check the flight CPU internal message queues can be adjusted as well.
The number of entries in the message queues are displayed in the Message Queues windows for each of the six message queues. The status can be updated manually by executing the Req Stat command.
The process ID's for the seven processes on the flight CPU are displayed in the PID's panel.
The changes can be transmitted to the balloon by pressing Submit. All displayed settings will be transmitted by pressing Force. To leave the panel without transmitting the changes to the instrument, press Cancel.
Flight computer hard disk system
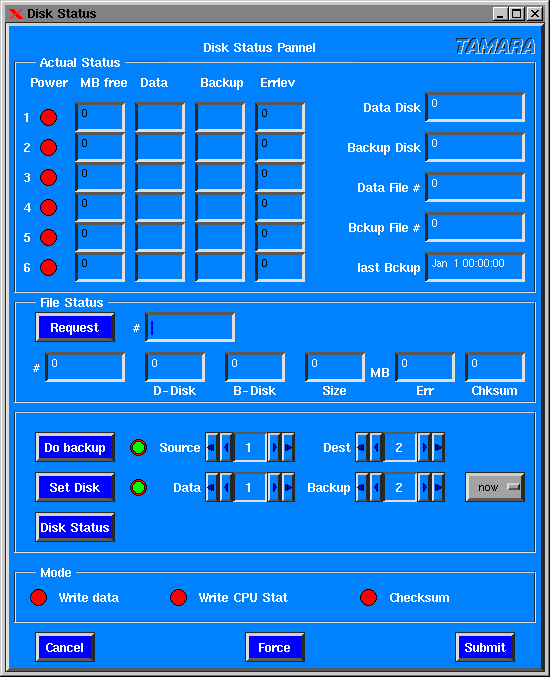
This panel allows to control the flight CPU hard drives. The current status of all hard drives is displayed together with the current data and backup disk, as well as the actual data and backup file number and the time of the last backup. The status can be updated manually with the Disk Status button.
The status of a specific file can be requested by executing the Request command and will be displayed in the File Status area.
A backup from one disk to another can be initiated by the Do backup command. A red light next to the button indicates, that a backup is executed at the moment. A green light indicates, that a new command can be executed.
The actual data and backup disks can be selected by the Set Disk button. A red light indicates, that the disks are currently switched. The light switches to green after the switch process is completed. The options now and backup can be selected for the switch disk command, the latter executes a backup of the current data to backup disk before switching to the new disks.
The buttons in the Mode area allow to switch on and off different options. The event data can be written to the hard drives. The flight CPU status can be written to the hard drives. A checksum can be calculated for each file.
The changes can be transmitted to the balloon by pressing Submit. All displayed settings will be transmitted by pressing Force. To leave the panel without transmitting the changes to the instrument, press Cancel.
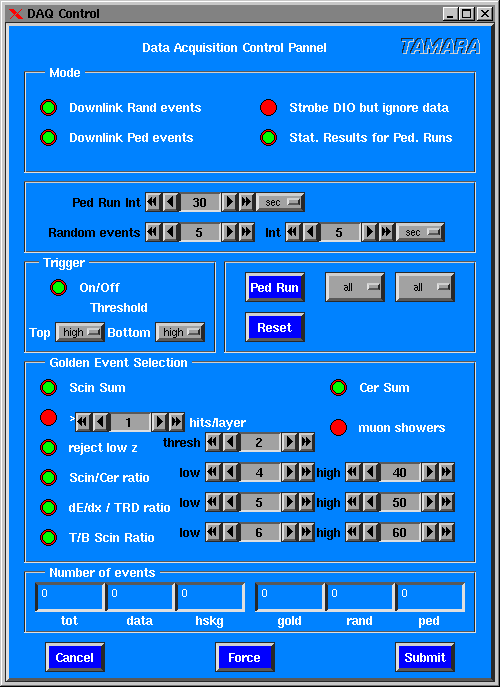
This panel serves to configure the properties of the data acquisition. The data acquisition mode can be configured within the Mode area. The transmission of random and pedestal events can be switched on and off. The results of a pedestal run (pedestal and sigma) can be transmitted to ground. Strobe DIO but ignore data means, that the hardware buffers are emptied, but the data are ignored.
A pedestal run can be initiated automatically in a selectable interval. A selectable number of events will be extracted from the data stream in an adjustable interval and will be transmitted to the ground.
The main instrument trigger can be enabled and disabled by the On/Off button. A low and high threshold can be adjusted for the top and bottom scintillator/Cherenkov counter.
A pedestal run can be requested for all FiFos or for a group of eight FiFos by the Ped Run command. The pedestals were measured either for all channels (all) or only for these, which are switched on in the AMPLEX threshold control (config).
The The number of processed events for different classes are displayed in
the Number of events area.
The total number of events (data plus housekeeping), the data
(golden, random, and pedestal events) and housekeeping events,
as well as the number of golden, randomly selected, and pedestal map
events.
The changes can be transmitted to the balloon by pressing Submit.
All displayed settings will be transmitted by pressing Force.
To leave the panel without transmitting the changes to the instrument, press
Cancel.
The data to monitor the instrument are available in several files.
The format of these files is PAW compatible.
The files are listed in the following:
Logfiles
All executed commands are written to a file send.log.
All messages from the instrument are logged in the file receive.log.
The event data are written to files events.dump_...
Postscript output
The current status of each panel can be printed to a file in Post Script
format by a mouse click to the word TAMARA in the upper right corner of
each window.
Jörg R. Hörandel