TRACER Thermal Analysis
TRACER
Transition Radiation Array for Cosmic Energetic Radiation
|

|
Thermal Analysis of the TRACER Instrument
Jörg R. Hörandel
April 18, 1999
Introduction
The results of the thermal analysis of the
TRACER
instrument are summarized in the following.
Due to the unidirectional solar panels of the TRACER instrument, one
side of the instrument points towards the sun permanently.
Therefore we will expect large temperature gradients along the instrument.
During the day the front surface of the gondola is exposed to the solar
radiation of about 1350 W/m2.
In addition the bottom part "sees" albedo radiation reflected from
the earth's atmosphere and surface. The value of the albedo radiation
depends on the environmental conditions an covers a range from 10% (sea)
up to 80% (clouds or snow), corresponding to a range from 135 W/m2
to 1080 W/m2.
Independent of day or night the black body radiation of the earth is
250 W/m2.
On the other hand all outside surfaces radiate towards "deep space"
according to Boltzmann's law P=A s T4. For a room temperature
surface (T=25 C) the value of radiation losses is about 450 W/m2.
In 35 km to 40 km height the air density is only 1/200 of the normal density,
therefore the heat losses due to convection are less important, but still
present and difficult to integrate into the calculations.
The various processes leading to energy loss and gain are sketched in
Figure 1.
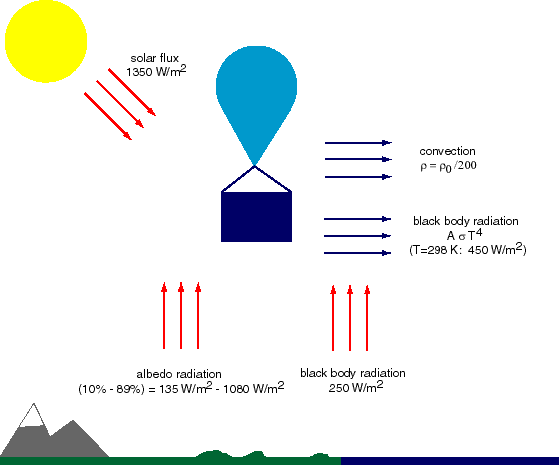
Figure 1: Energy gain (red) and loss (blue) processes for a balloon
instrument.
The processes discussed above lead to large temperature differences
on the gondola surfaces as it it visible in Figures 5 and 10.
Regardless of this huge gradients the temperature of the detector
inside the insulation should be more or less independent of the environmental
conditions (day/night, different albedo values) at values corresponding
to room temperatures.
In addition the temperature gradients along the detector should be as low
as possible.
Objective of the present investigations is to optimize the insulation
of the instrument to obtain the discussed goals.
The presented results are based on calculations using the program
SINDA/Thermal Desktop (Cullimore & Ring Technologies) .
Internal Heat Sources
The heat sources can be divided into two groups.
Outside the pressure vessel:
| AMPLEX Boards | 20 W |
| AMPLEX Crate | 11 W |
| PM Crate | 13 W |
| Shaping Amplifier | 10 W |
| Sum Amplifier | 3 W |
| Sum | 57 W |
| 70% efficiency | 81 W |
| DC Converter | 24 W |
| Top Heater | 20 W |
And inside the pressure vessel:
| Main electronics | 13 W |
| DAQ/VME/CPU | 105 W |
| Sum | 118 W |
| 70% efficiency | 169 W |
| DC converter | 50 W |
The position of the heat sources is shown in Figure 2.
A 20 W heater is necessary on top of the detector to keep the temperature
of the top scintillator in an acceptable range.
The temperatures without this heater are around -20 C to -15 C.
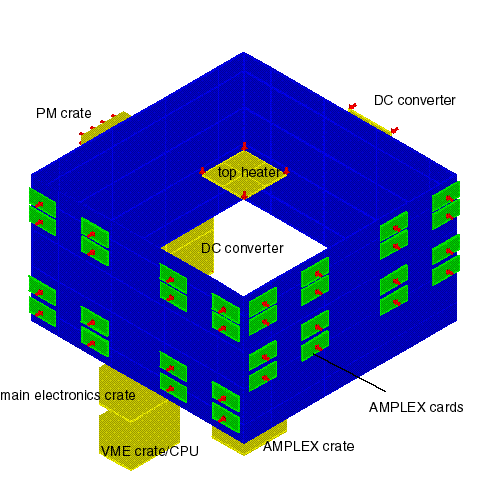
Figure 2: Heat sources included in the TRACER thermal model.
The Insulation
The whole instrument is surrounded by a foam box with a thickness of
10 cm.
The analysis is based on the use of FALCON Foam Type I with a
thermal conductivity of 0.23 BTU/h/ft2/(F/in)
or 0.0314 W/(m K)
available at TUSCARORA Inc., Burlington.
The outside of the foam is covered by a 3 mil aluminized Mylar film
with an absorbtivity alpha=0.17 and an emissivity epsilon=0.76.
The aluminum side must face the foam.
Aluminized Mylar Dunmore DE 070, available at Spectrum Astro Inc.,
maximum width 60 in.
Or aluminized polyester Film Melinex available at SCHARR Industries Inc.,
60 in width.
It mus be checked wether the thermal properties of this material are in the
correct range.
The inside of the foam box is covered with aluminum foil
e. g. 3M Aluminum Foil Tape # 425, available from 1/2 in up to 24 in.
With an absorptivity alpha=0.20 and an emissivity epsilon=0.03.
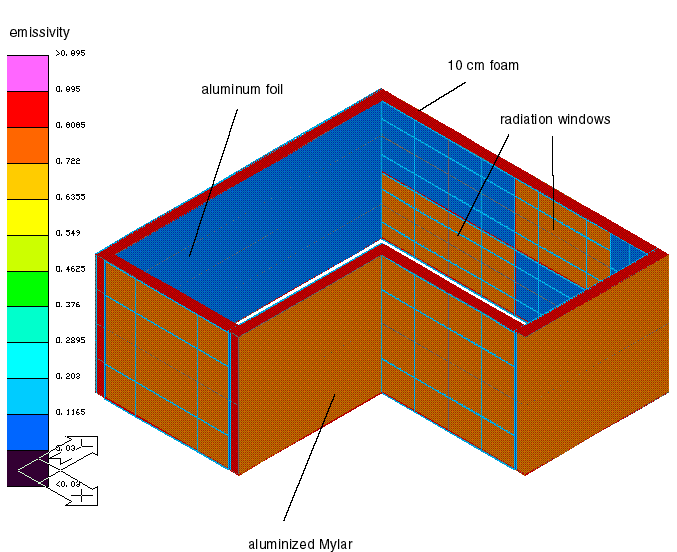
Figure 3: Shematic view of the lower part of the TRACER insulation.
As scetched in Figure 3 the backside of the lower part of
the insulation has two radiation windows covered with aluminized Mylar
instead of aluminum foil.
This windows are important for the temperature inside the insulation.
One window is behind the pressure vessel DC converters and has the same size
ans shape as the converter base plate.
The second window is in the lower left corner to cool the pressure vessel.
We can adjust the instrument temperature by changing the size of this window.
The present size is 140 cm x 60 cm. The size may be changed using more
detailled calculations.
To become independent of the extreme variations between day and night as well
as from the albedo variations we need two radiation shields in addition
to the foam box.
One shield at the front (sunny) side and a shield on the bottom.
Depending on the design of the bottem part of the gondola (ballast, crash
pads, etc.) the latter is not necessary.
The shields concist of 5 cm foam covered with aluminized mylar on the
front and aluminum foil on the back side.
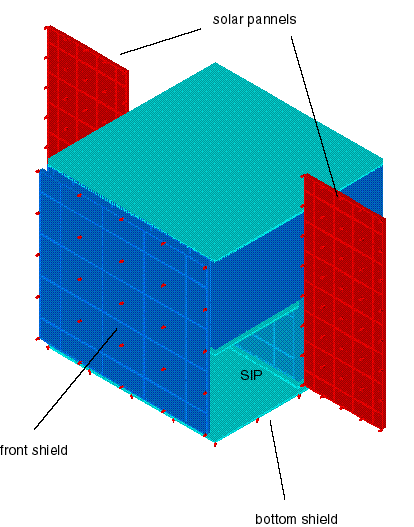
Figure 4: Shematic view of the TRACER insulation.
The complete insulation including the radiation shields is scteched in
Figure 4.
Depending on NSBF we may have no shield directly in front of the SIP.
Predicted Temperatures
The environmental conditions (day and night times, albedo values)
during a LDB flight from Alaska are different
from a 3 day flight from New Mexico.
The insulation should be independent of this values. Therefore in the following
two extreme cases are presented.
The first, assuming full solar flux of 1350 W/m2 and maximum
albedo + black body radiation from the earth = 1330 W/m2.
And a second case with only 250 W/m2 black body radiation from the
earth's surface.
Steady state conditions have been calculated for both cases.
The real temperatures during a flight will be in between the presented
extremas.
All temperatures are plotted in K.
Day Time Temperature
Figures 5 to 9 show the temperatures for different parts of the TRACER
instrument for the maximum radiation case.
The outside temperatures are displayed in Figure 5.
Values arround 100 C on the front side of the solar pannels
and up to 150 C on the front shield can be observerd.
The temperatures inside the insulation are in the order of room temperature
as can be seen in Figures 6 to 8.
Due to the top heater even the top scintillator has an acceptable temperature.
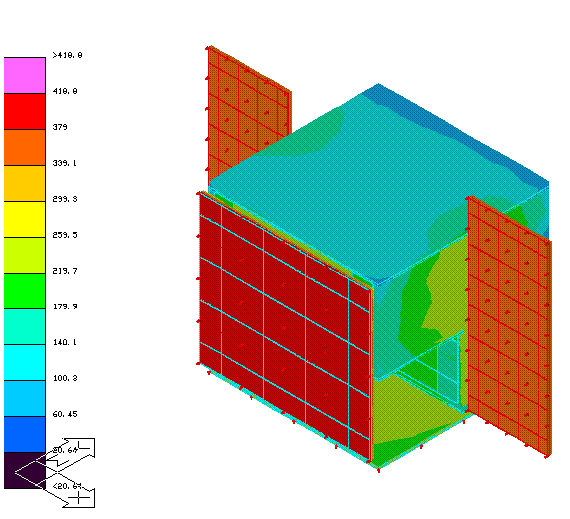
Figure 5: Day time temperatures of insulation and solar pannels (sw).
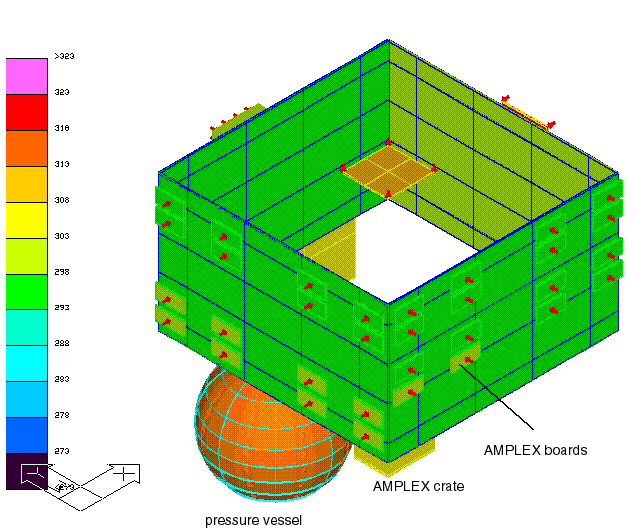
Figure 6: Day Time temperatures of several detector components (sw).
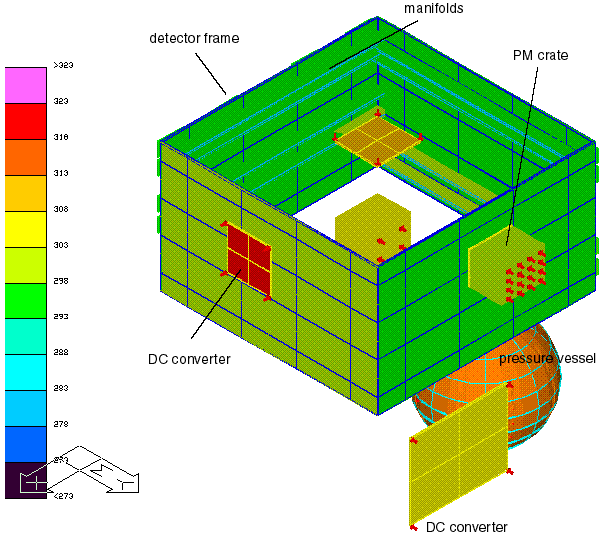
Figure 7: Day time temperature of several detector components (ne)
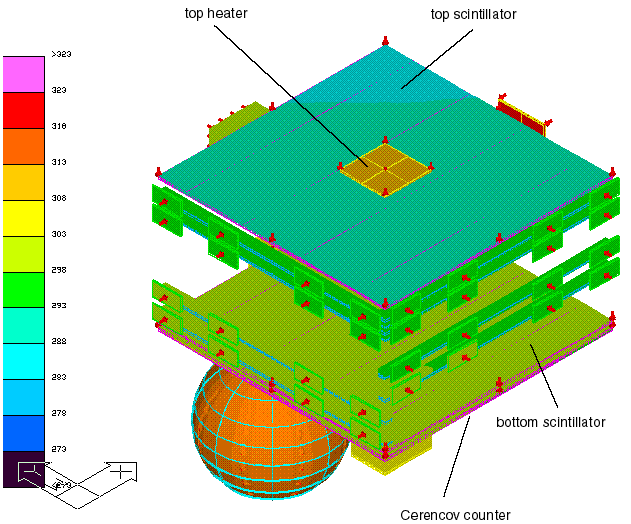
Figure 8: Day time temperature of scintillator and Cerenkov counters (sw)
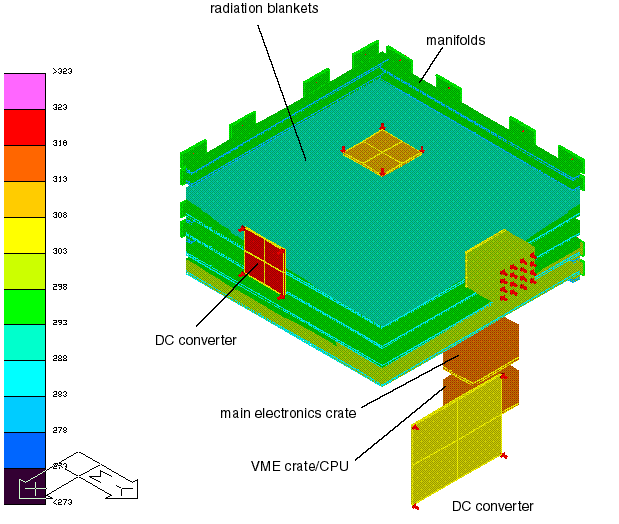
Figure 9: Day time temperature of radiator material inside detector (ne)
Night Time Temperature
The results for the "cold" case are presented in Figures 10 to 14.
In Figure 10, the influence of the radiation windows can be observed.
Figures 11 to 14 are showing that even during an infinite night
the temperatures inside the insulation are arround room temperature.
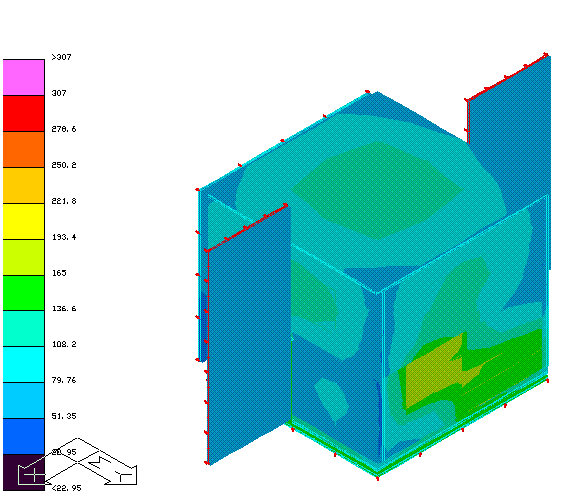
Figure 10: Night time temperature of insulation and solar pannels (ne).
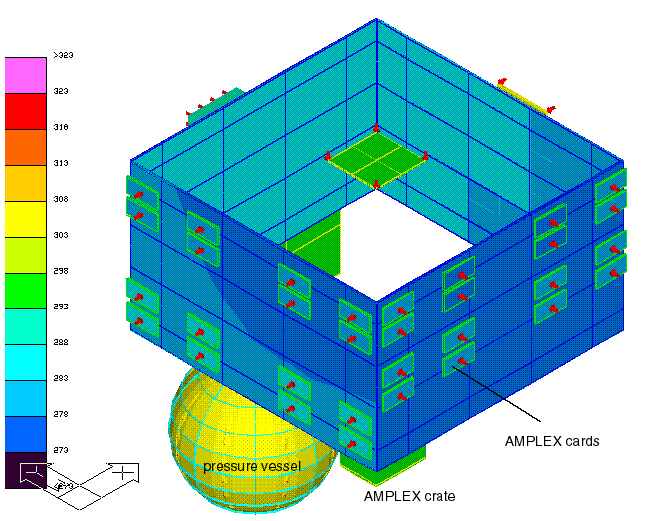
Figure 11: Night time temperature of detector frame (ne).
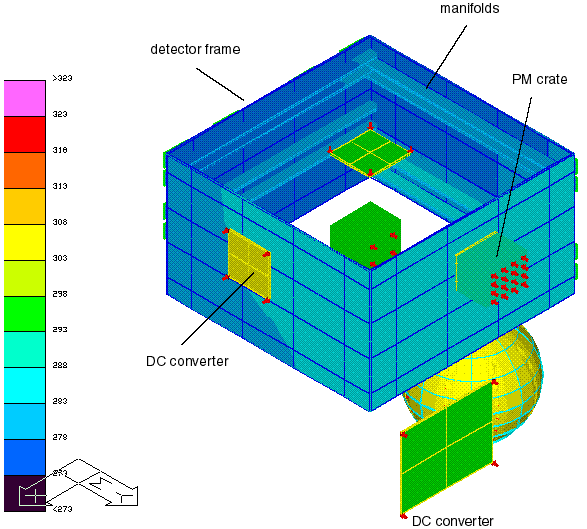
Figure 12: Night time temperature of several detector components (ne)
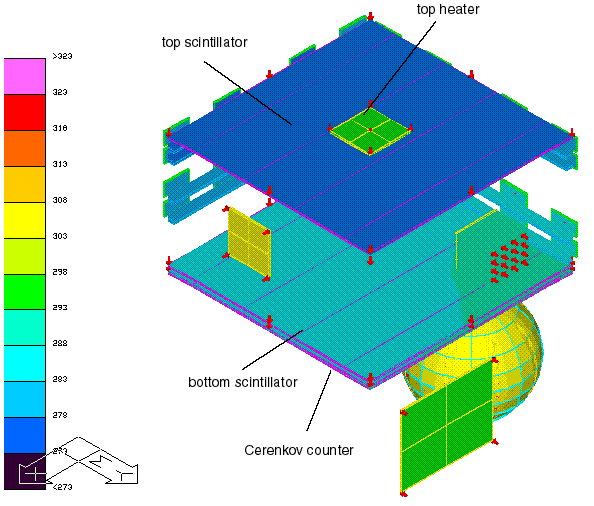
Figure 13: Night time temperature of scintillation and Cerenkov counters (ne)
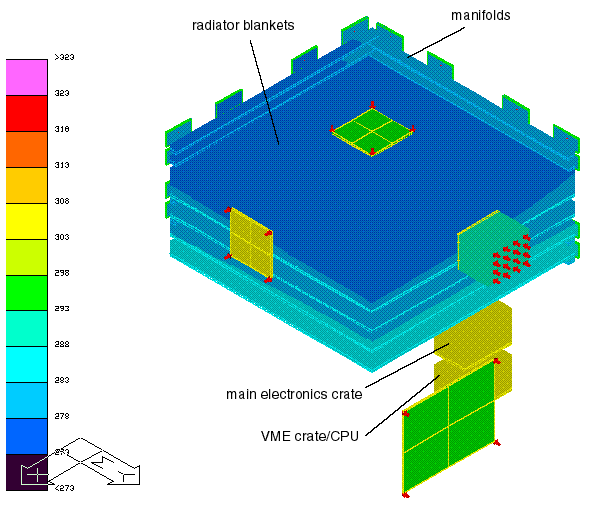
Figure 14: Night time temperature of radiator material inside detector (ne).
Conclusion
The proposed insulation system is sufficient to keep the temperatures
inside the insulation in the required range.
The detector temperatures show only a small variation compared to the
extreme enviromental variations.
The temperature gradients along the detector are arround 5 C to 10 C.
Jörg R. Hörandel


